Partnerships

Thespot2be is the interactive spot guide for your windsurfing, kitesurfing, wingsurfing and surfing community.
Thespot2be is a collaborative site, made by windsurfing, kitesurfing, wingsurfing and surfing riders for riders. Discover new spots, take advantage of personalized spot recommendations, check the weather forecast, chat with the community and share your sessions.
JMG-APP Surfing-Paddling

The first and most complete application of the Garmin store for surfing (sea and river) and paddle surfing, currently available in 4 languages (English, French, Spanish, Italian).
Seven screens are available:
- screen 1: main screen (current speed, the number of left and right surfs made since the beginning of the session, the elapsed distance, the temperature, the time in stop / pause mode, or the chrono in running mode, and the indicator GPS signal quality (green = good, orange = medium, red = poor or nonexistent), and your current HR with colored HR zones
- screen 2: screen of the current session (accelerometer, heart rate with colored HR zones, the last three data of the last surf realized, in white (time - distance - speed), and the three data of the best surf realized during the session, in orange (time - distance - speed)
- screen 3 (only for high memory devices): uses the same data as the second screen, but in graphical form, with the addition of the time (in 12/24 hour format) and the current speed (see the descriptive image below for more explanations)
- screen 4 (only for high memory devices): "Ideal Spot" geolocation screen. This screen allows you to record your GPS position on the water at any time, and return to it using a heading and distance indication (see explanations below)
- screen 5: mapping screen (compatible models) with the track of your session and the visualisation of the "Perfect Spot" -> please see below for more explanations
- screen 6: screen of the best surf realized with, the best time, the longest distance traveled, and the best time, compared to the best surf over all the sessions
- statistical screen: the total number of surfing, the total distance, the surfing and swimming times, all sessions combined, in value and represented on a ratio gauge (surf time in purple and swimming time in pink)
- end session screen: displays a summary of the main data obtained during the session
The following data are recorded in the FIT file:
- in graphic form:
- speed, in km / h or knots (graph, Garmin default data)
- altitude (graph, Garmin default data)
- calorie expenditure during the session (Garmin default data)
- the speed of each surf, visible on the timeline (blue graph)
- the distance of each surf, visible on the timeline (green graph)
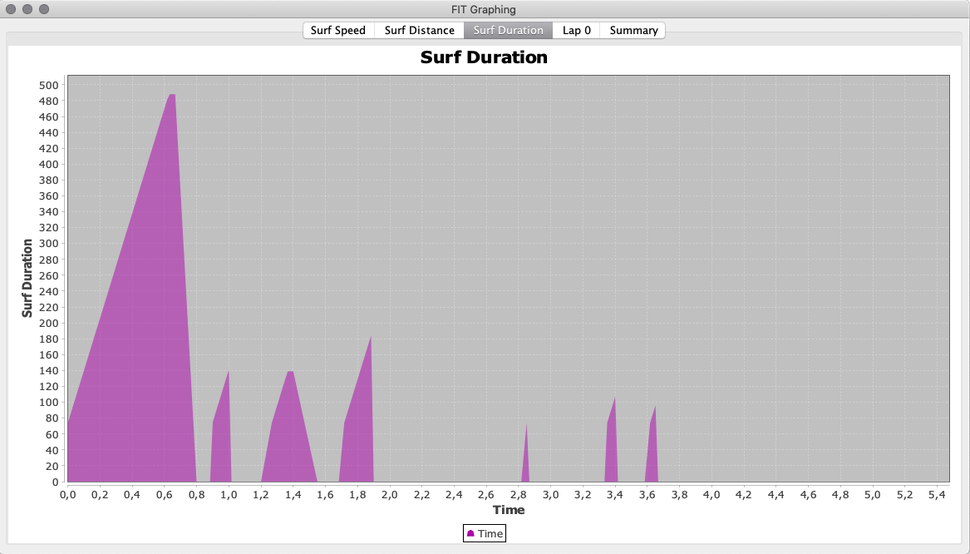
- the duration of each surf, visible on the timeline (purple graph)
- as laps:
- each surf done with, as recorded data, its duration, the surf distance and the average surf speed
- in the activity summary area:
- the number of surfs on the right and left sides of the session
- the number of aerials made during the session
- the total surfing time of the session
- the total swimming / paddling time of the session
- the best surf time of the session
- longest surfing distance of the session
- the best surf speed of the session
- the rating of your session
Note: all the options set in the menu are permanently saved into the watch so, no need to configure them each time you launch the application.
Note regarding models with semi-octagonal screen (Instinct 2, 2S and Descent G1:
due to their lower amount of memory, and their monochrome screen truncated by the physical circle, the application has the following differences compared to other models:
- no display of weather forecasts (but they nevertheless exist in the application when retrieving weather data)
- no display of global statistics
- no ability to assign scores/stats
- no second end of session screen
Apart from these differences, all the other functionalities are strictly identical to the other models.
Given its complexity and time spent developing, the price of this application is set to 11 US dollars.
For further detailed explanations, you can consult the detailed images below.
Despite all the care taken in this application, it could remain some hidden bugs, or possible malfunctions. Therefore, thank you to contact me directly by email to inform me rather than posting bad comments on the site, I will then do what is necessary to fix the issue as soon as possible. Thank you in advance.
Currently unemployed, I develop applications for the Garmin community to stay active and in the wind.
The paid version can be unlocked via my Paypal account (see the link above), with the possibility to pay with credit cards too.
Don't forget to mention, in your PayPal comment or your additional email, your identifier number (displayed on top of the popup screen when launching the app for the first time), in order to be able to calculate your activation code.
Please, feel free to enjoy !
Procedure
Entering the activation code
For all watch models, the activation code is entered directly from the application menu:
long press to the UP key (or swipe left on touchscreen devices) then go to "Tools -> Activation Code -> Unlock Code"
When your activation code is not already set and saved into the app, you will find, within this menu, your ID number instead.
Trial period / Testing the app
Users without a registered license have the possibility to start a session and test the application for a maximum of 20 minutes, each day. During this period, all data and metrics are properly calculated, and will therefore be saved into the FIT file.
Arrived at the end of the 20 minutes, the application will then automatically switch to pause / stop session mode: here, you will always have the possibility to browse all the screens (to see the results on the screen), or to leave the session, either saving it or ignoring it.
The duration of 20 minutes can be combined on the same day: 1 session of 20 minutes, or 2 sessions of 10 minutes, etc.
When starting / launching the application
You will be greeted with a welcome popup screen which, depending on whether you are female or male, will match with a custom image, as below. This screen, which will be displayed during about 5 seconds, also shows you the current version number of the application, which allows you to see, at a glance, whether it is up to date or not.


Preparing and using the app
- launch the application, like any other application
- first, you should set the application to your needs (background color, units, etc.). To do this, enter the application menu (long press the UP button) and select the parameters at your convenience. All the choices made in the menu are permanently stored on the watch so there is no need to re-enter them each time the application is launched.
- the application offers you two surf detection modes, an automatic mode and a manual mode:
- automatic mode -> as its name suggests, this mode allows the automatic detection of each surf performed (introduced in version 1.55 therefore, in beta-test for the moment, in order to see if it works well as expected - normally , it should). Note that in this mode, you will not have access to the weather web service since useless here. This mode is currently only available for models with at least 124 KB of useful memory for applications (if it proves its efficacity, I will add it by default for devices with 64 KB)
- manual mode -> this mode allows you to manually define a surf detection, by entering the minimum speed from which a surf will be detected (entry in the menu - press the UP key - then, "Surf Speed ". You then have the choice between 2 options:
-
- either enter the speed value directly ("Set Surf Speed" menu) in the currently selected unit (km/h or knots), because you already know it or easily estimate it
- either by calculating the wave periodicity ("Set Wave Period" menu). It's very simple: watch the waves and count the number of seconds between each wave (for example, take a landmark for the first wave, and count the number of seconds between the arrival of the next wave at this same landmark). Enter the calculated value, in seconds, using the selector and confirm. The application will then automatically deduce the speed of the waves. Also here, if you have entered an API key for the weather web service, the service menu is offered to you, and the speed will be automatically calculated using the data collected by the request. Finally, if you use the request on the weather web service, you have the possibility to display the temperature of the collected data (and not only the temperature from the internal sensor): to do it, go to "Options -> Temperature (Internal / Web Service)" menu
- in the 2 modes -> you will finally have to determine a threshold duration from which a surf will be detected as is by the application. Depending on the spot where you practice, the waves can be higher or lower, last longer or shorter therefore, some waves will be able to generate surf of 6-7 seconds, others with a duration greater than 20-30 seconds . So not all spots are equal. This trigger duration allows you to adapt this threshold according to the spot conditions. Note that on models with only 64 KB of useful memory, this threshold cannot be modified by the user, it is therefore fixed hard, by default at 6 seconds. Usefulness of this threshold: avoid counting false positives (start of surf interrupted by the surfer, fall just after the start, etc.). To access this option, it's here, in the "Surf Detection -> Trigger Point" menu
- once all the parameters are fixed (detection mode, surfing speed, trigger duration threshold, etc.), you can exit the menu to return to one of the application screens
- point the north of your watch facing the waves to recover their course in degrees (at the top right of the main screen, you have a red area indicating the current course); this setting will allow you to determine and record your surfs right or left side for each surfed wave). You will notice that the value indicates a heading increased by 180 ° compared to in front of you, in fact, the waves going towards you, they therefore follow an opposite course of 180° in relation to your watch, facing the waves
- finally, launch the application by pressing the START key (the red zone of the waves course becomes green)
Note regarding the wave axis recovery (new behavior introduced from version 2.61 of February 12, 2023):
wave heading retrieval works differently depending on whether you have retrieved weather data or not.
- no weather data in the application -> at the start of each new session, whether on the same spot or on a different spot (several sessions on the same day), pressing the START button to launch the session, systematically retrieves the axis of the waves, thereby considering that the orientation of the waves may have varied in the meantime (especially in the event of a change of spot on the same day). This is true for both surf detection modes, manual and automatic modes.
- weather data is present within the application -> the orientation of the waves comes from the weather data and remains stored for a period of 8 hours therefore, pressing the START button will not recover the axis of the waves (this operation does not change previous versions). If a new session is launched during the day, whether on the same spot or on a different spot, you will therefore have to retrieve new weather data, or manually retrieve the new axis of the waves, in manual mode (menu "Surf Detection -> Swell Direction - Get Axis", or long press on the upper right area of the main screen)
- scrolling between screens is achieved by just pressing the UP or DOWN key. When the wide screen is displayed, UP and DOWN keys change the type of data displayed on the top and bottom fields
- you can pause the session by pressing the START key then "Pause" menu, and resume recording with a second press on the same key then, "Resume" menu
(pause = orange dots, active = green dots, stop = red dots)
- to end the session, you press the START key, a menu appears, proposing you to either reject or save the session. Then, a summary screen will be proposed to you, summarizing the main data of the session
- to quit the application in stop mode (when no session has been started), click on the LAP button, not on the START button
- the current time is displayed in the following 3 modes: when the application is waiting to be started, in pause mode, and in the minimalist screen otherwise, the timer is displayed.
How to set and use weather web services
First of all, I should point out that this functionality is only available on models with 1024 KB of useful memory for applications, that is to say, applications with mapping and / or music options.
First, go to the website offered by the application (currently only one):
the link directly brings you to the presentation page of the proposed formulas, the free version is on the left, click on the "Sign Up" button, enter the requested information. Once your account is created, you will be able to access the dashboard, which will then give you access to your API key.
Remember to keep this API key, because it can also be used in the future, in case you have to re-enter it in the application following a replacement of your watch, for example.
Your key received, you will then enter it in the application settings, in the field corresponding to the site you have selected. To do this, connect your watch with your smartphone and open Garmin Connect (or a computer with Garmin Express). Select the Surfing application from the list of your applications, and open the settings: four fields appear at the top of the page. Copy and paste your API key in the corresponding field and confirm your entry. There it's done, the API key is automatically transferred to the Surfing app. Note that yours keys are automatically saved on your watch, in the permanent settings of the application, so you will not have to re-enter them, unless you change your watch.
Note: if the API key has been saved in the field of the settings file, but you can't see the corresponding menu in the web service menu of the application, please proceed as follow:
- activate the bluetooth mode of the watch and connect it with your smartphone then, launch the Garmin Connect application
- launch the Surfing app on the watch, and stay on the main screen
- on your smartphone, in Garmin Connect, go to the list of the applications installed on the watch, select the Surfing application and open the settings tab
- the API key(s) should appear; otherwise, re-enter it (them) and save the modifications
- this time, the API keys must have been sent to the application on the watch
Finally, to be able to use this function, and thus recover the wind data automatically in the application:
- put your watch in connectivity mode (bluetooth activated)
- launch Garmin Connect on your smartphone
- launch the Surfing application from your watch
- the phone connection notification icon (top right of the main screen) should light up in blue
- enter the main menu of the application, and go to the "Surf Detection -> Automatic Swell Data" menu.
- press the START key to connect to the web service and collect weather data. That's it, it's done, the wind speed + wind direction / axis data are now integrated into the application, you should see them displayed on the main screen, in the same way as if you had performed this function manually (like in the past). After a few seconds, a menu opens, offering you whether or not to display the 6 o'clock forecast.
- finally, if you wish, don't forget to deactivate the bluetooth mode on the watch in order to avoid additional battery consumption
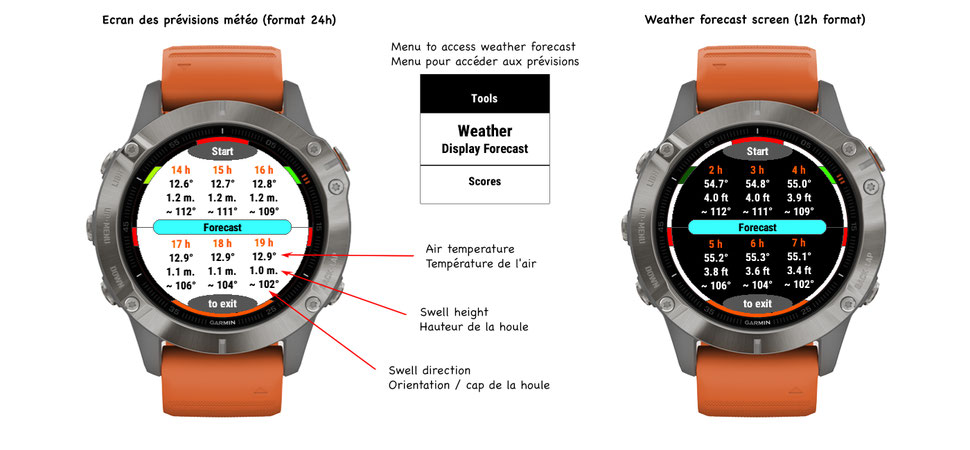
The request collects all the infos displayed on the pic below, and all the necessary data of the app are automatically calculated regarding this request so, everything is automatic. You just need to continue to point your watch towards the waves just when you start your session, like before.

Result of the request ----->

8-hour weather forecasts
From version 1.90 of the application, it manages weather forecasts for a period of up to 8 hours.
If you use the following weather web services StormGlass, you will automatically obtain the weather forecast for the next upcoming 8 hours.
These forecasts are stored directly on the watch disk when they are collected, to be used then, hour by hour, during the session.
This therefore means that, during the course of your session, the weather data such as the air temperature, the wind axis, and its speed will be automatically updated, hour by hour, and in a completely transparent manner, at each change of plain hour (2 p.m. - 3 p.m. - 4 p.m. - etc); so you don't have to do anything other than retrieve the forecast before you start your session, that's it, then the app does the rest!
This new feature is very useful because the change in weather data (wind axis and speed) will have a direct influence on a large number of calculations performed by the application (efficiency of your navigation in relation to the wind axis , etc), and the resulting results, hour after hour, will be automatically reflected within the application.
Whereas previously, when you entered or retrieved weather data manually or through a weather web service, this data did not change during the session, even though the weather conditions could change during the session, that is often the case!
This adds a little more precision and reliability to all calculations performed by the application.
The forecasts stored by the application are checked every 30 minutes, in order to not have any one hour delay.
For example, if you retrieve the weather data at 2:10 pm, the next check will take place at 2:40 pm, no change since it is not 3:00 pm, next check at 3:10 pm and there, any possible change in the weather data, and so on until the eighth hour stored.
If you retrieve the weather data at 2:45 pm, the next check will take place at 3:15 pm and therefore, the weather data may be updated since the time is no longer the same (we went from 2 to 3 pm).
Even better: let's imagine that during the day, you ended your morning session to take a little lunch break, for example. Two hours later, you relaunch the app for your new afternoon session, so two hours have passed in between. Well, at the time of this second launch, the data will be automatically updated according to the new time.
On the other hand, if this second launch takes place beyond the 8 hours of the stored forecasts (for example, you end the first session at 10 am, and you restart the second at 7 pm), you will only retrieve the last data. known at 10 am. If you want to be up to date, you will therefore have to update this data again by reconnecting to the weather web service in order to retrieve the updated data.
Finally, if after having retrieved the weather forecasts you subsequently update the weather data manually, the forecasts file will be instantly deleted from the watch disk, then you will lose all the forecasts stored for the upcoming hours (considering that if there has been a manual modification a posteriori, this probably means that the forecasts were not reliable or stable in relation to the real conditions on the spot). So, if you want to find these forecasts, you will need to collect new data again.
Note:
• forecasts are retrieved over a maximum period of 8 hours so, if you start your session at 1 pm for example, the application will have access to forecasts until 8 pm (the eighth hour is also included)
• forecasts are blocked by default from 10 pm, since no rider is supposed to sail… at night. So if you start your session at 4 pm for example, you will only get the forecast for the next 6 hours
• you can see how this weather forecasts feature works, and its repercussions within the app, by viewing the following video:
This video shows the Surfing application in action (which uses the swell data from the StormGlass site) but, it works exactly the same way in the Surfing application, except that instead of the swell data, here the axis and wind speed data are used instead
Tides forecast up to 48 hours
When you collect automatic weather data as explained just above, you also get automatically the tide forecasts, up to 48 hours.
If there are available, you can view the tide forecasts by entering the "Tools -> Tides - Display Forecast" menu.

"Perfect Spot" geolocation screen
This screen allows you to record your GPS position at any time when you are in the water and, when you have surfed a wave and want to come back to this point, you just need to follow the instructions displayed on screen , and there you go !
This can be very useful when, for example, you find an ideal starting point for surfing and you want to be able to come back to it after having drifted hundreds of meters after a surf, for example. With this screen, you will thus have the possibility to easily retreive this "ideal point".
Operation:
- when you are in the water and want to save a POI, simply press the LAP / BACK key of the watch (swipe to the right for watches with a touch screen only). A popup then appears on the screen, associated with a vibration, to indicate that the POI has just been saved. The screen dedicated to the sweet spot management is then activated
- surf the wave, you will then move away from this POI
- to come back to this precise POI, the blue cursor indicates the course towards this point compared to your current position: for example, on the explanatory image below, the course to follow is indicated by the value on the top, and corresponds to the direction almost south from your position (WWS). The bottom value also tells you the distance from this POI
- for users who have no difficulty finding their way in space, they just have to go in the direction indicated (by the value and / or the cursor). For others, place your watch more or less horizontally and orient / turn it around you to match the blue cursor with the black line displayed on the north of the watch. When the two cursors are aligned, you just have to swim straight forward you, so simple!
- the closer you get to the POI and the more the distance value decreases, the colored central circle will remain red up to a distance of 20 meters then, will change thru orange, yellow, light green and dark green, by decrement of 5 meters. So, if you enter within a 5 meter perimeter around this POI, the circle will remain dark green, and you know that you are right on the POI! Cool, right?

A GPS point has just been defined and saved by pressing the BACK/LAP button, the sweet spot is saved

The blue cursor indicates the course to take to head for the sweet spot. The black line, north of the dial, serves as a reference point which, when the cursor is aligned with this line, will indicate to you that you must go straight ahead.

The blue cursor is aligned with the black line on the north side of the watch, pointing straight ahead towards the sweet spot.
The angle in degrees tells you the course to follow, as well as the distance separating you from the defined GPS point (in meters or yards, depending on the unit you have selected in the option menu)
Note:
- this functionality will only work efficiently and precisely depending on the quality of the GPS signal received by the watch and / or the precision or reliability of the sensors inside the watch, of course
- if you want to see / check how this functionality works, you can test it on the ground, it will work in the same way: start a session as usual, wait for the green dot of GPS signal quality, position yourself at a given point and press the LAP / BACK button. Then, move tens of meters and follow the steps / indications explained above to return to the sweet spot
- if no sweet spot is saved, the dedicated screen will not be displayed in the scrolling of screens, in order to avoid displaying an unnecessary screen in the carousel
- you can save as many sweet spots as you want by pressing BACK/LAP again (or swipe to the right), the coordinates will then be automatically adjusted to this new sweet spot, deleting those of the previous point
- if a sweet spot is saved, the feature also appears on the "wide scren" screens, as well as the map (for models equipped with it)
Scores Menu - View the global statistics

Scores Menu - Reset data/scores
You have the option to reset two types of data:
- only the best scores: your records, better performances. This data is displayed on the "Best Surf" screen
- all values: the best scores + all the data recorded over all your sessions ("Stat" screen)
Note that the reset is an irreversible function, all data will be lost after this action.
Scores Menu - Assign values / scores
This feature allows you to manually assign a value to the data displayed on the "Stats" screen. This can be useful for example in the case of a replacement / change of your watch, and you do not want to loose all your global statistics. The data entry follows the same order as the data displayed on the "Stats" screen, to simplify your input.
Minimalist screen
This screen presents the essentials and the minimum information, with an extended font (time, chrono, current speed, and colored arches - see the meaning of these arcs on the descriptive image below). This screen is easily readable during navigation, especially for surfers with a visual weakness and who can not wear their glasses in navigation.
This screen is activated in the application menu - Wide Screen -> Display on/off
When it is activated, it is displayed when the session is started and therefore active. When you put the session in pause mode, this screen disappears to make room for all other screens, so you can, for example, see your performance / detailed information when you pause. When you restart your session, the minimalist screen reappears again.
When this screen is selected and displayed:
- pressing the UP key changes the data displayed in the top field according to the selection you made in the Wide Screen - Top Field menu. On watches with a touch screen, a long press on the top area produces the same effect
- pressing the DOWN key changes the data displayed in the bottom field according to the selection you made in the Wide Screen - Bottom Field menu. On watches with a touch screen, a long press on the bottom area produces the same effect
GPS constellations (only for SDK 3.2.x compatible models)
If you find that your GPS track is not accurate enough, you can modify, directly into the application, the GPS constellation used by the application. You will have the choice between several constellations, only those which are compatible with your specific watch model, and available on it at a given moment. This option is activated by the menu "Options -> Constellation", and thus avoids you having to do it outside the application, before its launch! Simpler, and faster than ever.
Note: as Garmin updates your watch's firmware, the number and type of these constellations may vary, so check the list in the corresponding menu from time to time.
Features specific to touch screens
On the majority of models with a touch screen (some older models are not compatible with this feature), you can directly access certain common functions via two types of screen shortcuts:
- a short press (just tap on screen) on a delimited area of the screen
- a long press, either on a delimited area, or anywhere on screen
For more detailed explanation of these touch areas and the functions involved, see the descriptive image below.
Quick access menu
On models with a compatible touch screen, and compatible with SDK version 3.4.0 minimum, a long press on the lower right area of the screen opens a quick access menu to certain functions, thus saving you from having to navigate the main menu and its sub-menus to access these functions. However, this function can only be used in stop or pause mode, to prevent this menu from being triggered during a session.
On compatible non-touchscreen models, access to this quick menu is via a long press on the BACK/LAP button.

Features specific to touch screen models

Screens specific to Instinct 2, 2S and Descent G1 models


Slideshow


Obtaining the bearing of the waves

Minimalist screen

First and second screen

Third screen (graphical screen)

Geolocation screen - "Perfect Spot"

Mapping screen (compatible models)

Fourth screen and stats screen

End-of-session screens


FIT file data